Using the causal chain to make sense of the numbers
At 3ie, we stress the need for a good theory of change to underpin evaluation designs. Many 3ie-supported study teams illustrate the theory of change through some sort of flow chart linking inputs to outcomes. They lay out the assumptions behind their little arrows to a varying extent. But what they almost invariably fail to do is to collect data along the causal chain. Or, in the rare cases where they do have indicators across the causal chain, they don’t present them as such.
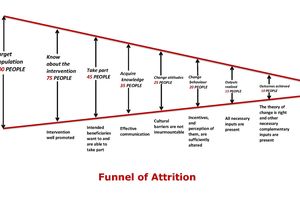
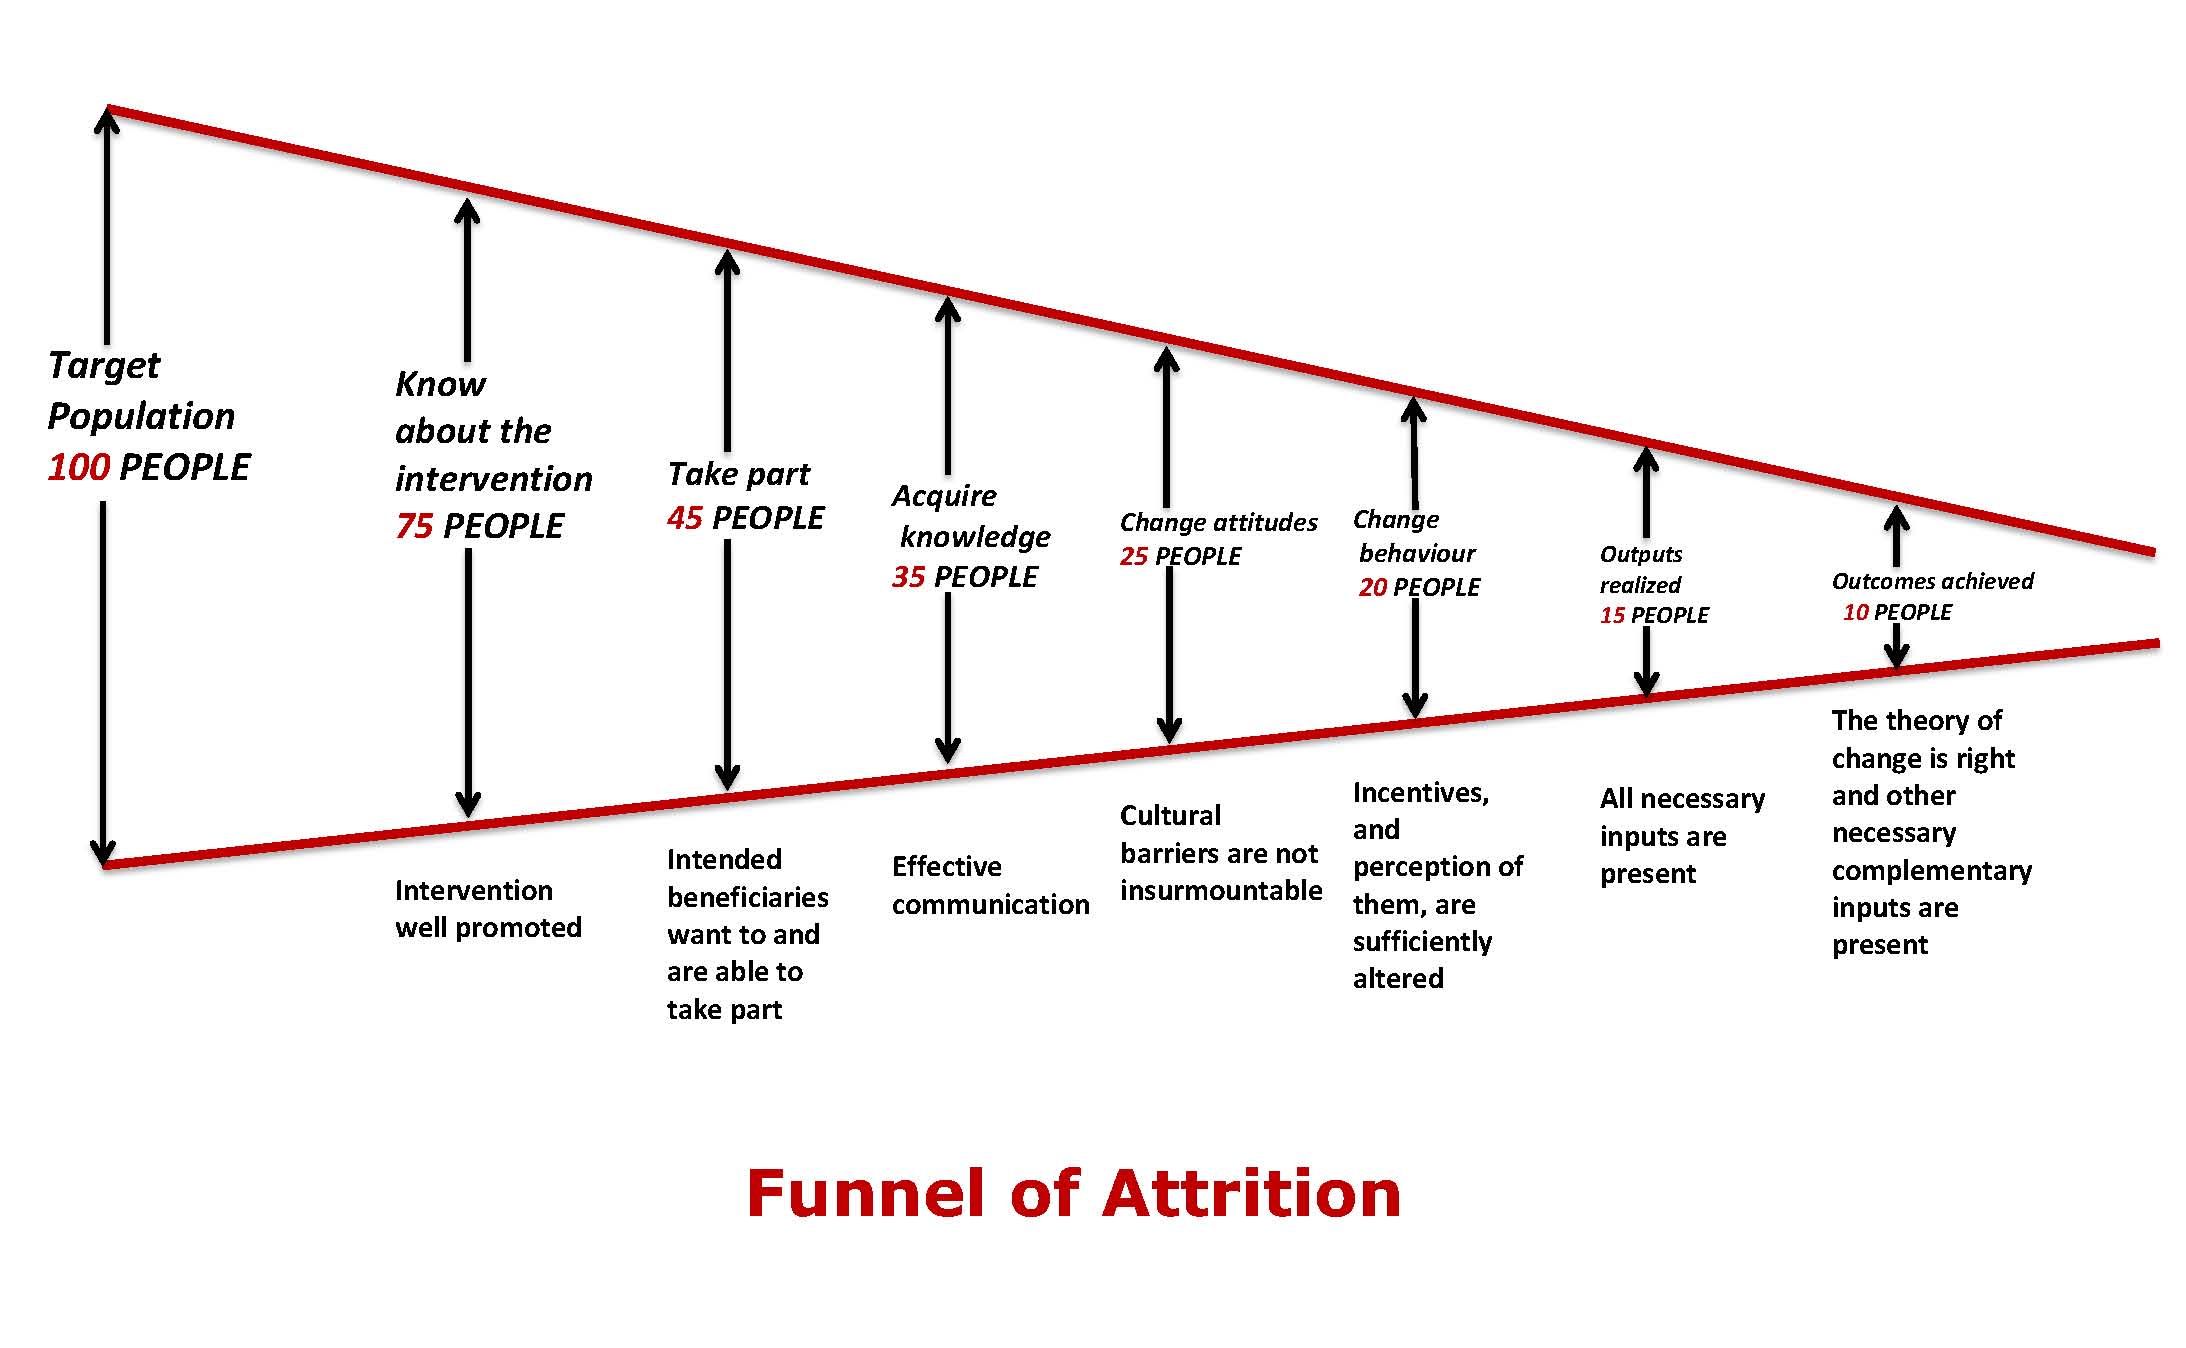
What do I mean? Take a look at the ‘Funnel of Attrition’ picture. Suppose there is a target population of 100 people for a project. How many of these 100 people actually know about the project? And of those, how many turn up to participate? And among those who participate how many actually understand what they are supposed to do? How many of those who understand actually agree and how many then do it? And does doing it result in the intended project outputs materialising? And if so how many people actually benefit? The answer to each of these questions gets progressively lower and lower. Grand claims about what the project will achieve are made under the assumption that all 100 of the target population experience the desired change in outcomes. But these claims rapidly vaporise in the journey through the narrowing funnel of attrition.
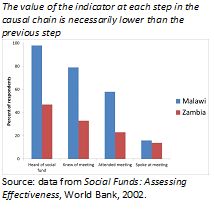 The second figure shows the funnel in action using data from the evaluation of social funds in Malawi and Zambia. Whilst the social fund is much more widely known in Malawi than Zambia, in the end the same low percentage of respondents in both countries had actively participated in the meeting at which the community project to be financed by the social fund was chosen. Given how ‘steep’ the funnel is, it is not surprising that the study found no impact on the intended outcome of social capital.
Normally the funnel will not narrow in the smooth manner shown in the first figure. Jumps in the funnel show where to look for breaks and weak links in the causal chain. Some ideas are given in the assumptions listed beneath the funnel. What are the reasons no one knows about the project and the attempts to reach the target group have failed? Maybe the project implementers are using print promotion for illiterates. The project workers possibly don’t speak the local language. Or the local leaders have failed to promote the project as they said they would. People know about the project but don’t show up? Then think about the barriers to their participation. Does the activity demand an unreasonable amount of time, or is it at a time or place that doesn’t suit them? Maybe influential community members have been speaking out against the project – after all community leaders really do matter. Or maybe what the project is offering is something people really just don’t want- a serious design failure. They come, but don’t acquire knowledge, or if they do they just don’t agree so attitudes don’t change. No big surprise there. Not everyone is an A student and, anyway, pedagogical methods are seriously wanting. Even if the project participants acquire the knowledge they may not change behaviour. No big surprise there either. It’s easy to say eat five pieces of fresh fruit or vegetable a day, exercise more, don’t smoke, don’t drink, don’t have unprotected sex. But just telling people stuff has a long track record of not changing behaviour. Other incentives usually have to change for behaviour to change. And they have to overcome cultural barriers to change attitude. And if the intended beneficiaries do fulfill their part then other things have to be there too. Conditional cash transfers and school feeding programmes both work at getting more children into school, but children won’t learn anything if the teacher is absent.
 Apparent breaks in the causal chain, illustrated by how the funnel becomes very steep, present a puzzle a good evaluation must answer. All the inputs were there. So why didn’t the output occur? We delivered all the intended outputs, so why didn’t outcomes change as expected? Maybe the study was just underpowered, but maybe complementary inputs were missing. You need to know which. By answering these questions an impact evaluation becomes really useful to the implementing agency.
Looking down the funnel, or along the causal chain, is an example of useful data analysis. And much of this analysis is straightforward factual analysis using at most bivariate tabulations of the data. It is not rocket science. It is how you treat the data properly to tell a story about the intervention, instead of just cleaning the data up a bit before throwing them into Stata.
Looking down the funnel has other implications for how we treat our data, particularly thinking about what our results mean. The cult of significance means that people rarely stop to consider what the effect size actually means. Sufficient power can give you significance at 0.1 percent with an impact which makes negligible difference to the lives of poor people.
And different ways of presenting regression models can give a misleading sense of impact. A large reduction in relative risk – a ‘good odds ratio’ – can reflect quite a small change in absolute risk. Three randomised controlled trials have found circumcision reduces the risk of transmission during unprotected sex by around 50 percent. The reduction in risk was from around 3.5 percent to 1.5 percent. Just a 2 percentage point absolute reduction, so 50 men need to be circumcised to avoid one new case of HIV/AIDS.
Data analysis also means looking for sources of heterogeneity across sub-groups, drawing on qualitative data and bivariate tabulations. Data from a survey of 12 villages in India with community-based natural resource management found that only around half of those surveyed had taken part in elections for the village committee. The researchers were busy running probit regressions to identify the characteristics of those who were excluded. But a look at the village narratives – short one to two page descriptions of each village and how the project is functioning there – showed that elections had only been held in six of the villages. And a bivariate tabulation confirmed that nearly everyone in villages where there was an election had voted whereas virtually no one had in the villages where there was no election. A few did claim they had voted in an election that didn’t take place, but that’s another story about survey biases. Fancy econometrics was less informative than just looking at the numbers. Using village fixed effects in the regression should have picked it up, but researchers don’t generally interpret the meaning of the coefficients on the fixed effect variables, though they should as significant coefficients mean you are missing something in your included variables.
Most impact evaluations don’t do this sort of analysis. It is not ‘difficult enough’ for researchers who need to publish in academic journals. But if we are to indeed improve lives with impact evaluations then we need better analysis which truly tackles the question of not only if programmes are working but where, for who and why.


Comments
great article! keep it up
Add new comment