Mixed-methods blog additional reading
Part 1
Section 1.1 The quantitative and qualitative research traditions
Most social researchers come from either a quantitative or qualitative research tradition. The traditions differ in terms of their professional training as well as how they approach research and evaluation. A stylized (simplified) description of quantitative-oriented evaluation works mainly with sample surveys and other forms of numerical data and using quantitative analytical approaches such as experimental (e.g., randomized control trials) and quasi-experimental designs (e.g., regression discontinuity and pretest-posttest comparison group designs using techniques such as propensity score matching for sample selection). Emphasis is placed on randomized selection to avoid selection bias and to make it possible to generalize from the sample to the total population. They tend to work with relatively large samples to make it possible to use statistical significance tests. Data is collected in a format permitting statistical analysis. They come from a positivist or post-positivist research paradigm which believes that “social research should adopt scientific methods that believes in the rigorous testing of hypotheses by means of data that take the form of quantitative measurement” (Atkinson and Hamersley 1994). Post-positivism evolved from positivism, with one of the distinctions being that positivists believed that their research was objective and value-free, while post-positivists recognized the important role of values at all stages of the research process.
In contrast, qualitative-oriented evaluation works primarily with in-depth narrative and descriptive data. It normally works with relatively small samples where each subject is studied in depth and often the focus is on studying organizational processes and behavioral change. A much wider range of data collection techniques is used combining individual and group interviews as well as observation and the study of artefacts (photographs, graffiti, household possessions, religious artefacts and clothing). While most quantitative methods focus on individual subjects, many qualitative researchers also study people in groups. People often respond differently in groups, and many techniques such as participatory rural appraisal (PRA) seek to capture group attitudes. Qualitative research normally adopts a constructivist paradigm (see the following note).
An important distinction between the two research approaches concerns how hypotheses are constructed. Most quantitative research uses deductive hypotheses. The hypotheses are derived logically from an existing theory or previous research and are defined at the start of the evaluation. Often the project is based upon a particular hypothesis, which is tested in the evaluation. Often the hypotheses will not be changed during the course of the evaluation, although it is possible that they may be refined based on initial research findings. For example, in the evaluation of a program to increase school enrolment and graduation rates, the hypothesis may be that the main reason that children do not attend school is because extreme poverty forces parents to keep children out of school so that they can earn money. This could be tested by comparing enrolment rates for households with different income levels. In contrast most qualitative evaluations develop inductive hypotheses where the hypotheses are identified based on exploratory fieldwork and observation. While the inductive hypothesis is defined before fieldwork begins, the inductive hypothesis will be refined as the evaluators gain a better understanding of the project, the attitudes of participants and the socio-economic context within which the project operates.
Further reading: Tashakkori, A; Johnson, B and Teddlie, C (2021) Foundations of mixed-methods research: Integrating quantitative and qualitative approaches in the social and behavioral sciences.
Section 1.2 The concept of paradigms
A paradigm has been defined as “a worldview held by a group of people (e.g., scholars) that includes a distinctive set of assumptions and beliefs about ontology, epistemology, axiology, methodology and rhetoric” [Tashakkori, Johnson and Teddlie (2021)]. This is “a system of beliefs and practices that influences how researchers select both the questions they study and methods they use to study them.” (Morgan 2007)
For our purposes, the importance of the concept of paradigms is that most social science researchers and evaluators can be divided into two main communities: quantitative researchers and qualitative researchers. In recent years, mixed-methods evaluation has emerged as a third paradigm, which plays an important role in complementing some of the limitations of the more widely-used quantitative and qualitative paradigms. The quantitative and qualitative paradigms have distinct approaches to how: research and evaluation questions are formulated, hypotheses are developed, data is collected and how subjects are selected, and how data is analyzed and used. These differences are not just about methodology but also concern beliefs about:
- Ontology: the nature of reality and what is studied – psychological phenomena, economic data, sociological data, etc. An important distinction is between objective reality, which is believed to exist independently of the observer, and which will be observed in the same way by different observers, and subjective reality (where observations and data are affected by an individual’s internal feelings and socio-cultural characteristics
- Epistemology: beliefs about knowledge and how we obtain knowledge. When can we claim that we have knowledge about something? For example, if a researcher asks a respondent about their household income, or their opinions on a particular topic, is the response considered to be an objective “fact” or is it the outcome of an interaction between two people. So, if the question is asked by a young black man or an older white woman, by someone who is perceived to be from an aid organization or from the government, would all receive the same answer?
- Axiology: refers to a set of values agreed to by the researchers. For example, a team of feminist researchers might all agree on some of the social, political and legal factors affecting women’s ability to fully participate in the life of their community.
The practical importance of the concept of paradigms is to help researchers to understand and assess some of the basic assumptions on which their approach to research is based, and also to understand the different sets of assumptions on which colleagues from different disciplines base their work. The mixed-methods approach helps quantitative and qualitative researchers, or researchers from different disciplines/paradigms (for example macro-economists, geographers and demographers may have different sets of assumptions about how to work with quantitative data) to develop a mixed-methods approach that can combine elements of both disciplines to strengthen the approaches with which they are familiar.
Further reading: Tashakkori, A, Johnson, B and Teddlie, C (2021) Foundations of mixed-methods research: Integrating quantitative and qualitative approaches in the social and behavioral sciences.
Section 1.3 Examples of the use of mixed-method evaluations in different sectors
Project |
Issues addressed with mixed methods |
Methodology |
| 1. Poverty analysis | ||
| A. Interhousehold transfers and survival strategies of low-income households in Cartagena, Colombia (Wandsbrough, Jones and Kappaz 2000) in Bamberger (editor 2000) “Integrating quantitative and qualitative research in development projects”. Directions in Development. World Bank |
|
|
| 2. Education | ||
|
A. The impacts of decentralization and community participation on educational quality and the participation of girls in Pakistan |
|
|
| 3. Agriculture and irrigation | ||
| A. Evaluating aquaculture programs in Bangladesh (3ie, ongoing) |
|
|
| 4. Health, water supply and sanitation | ||
| A. Evaluating the impacts of water supply projects in Indonesia (Brown 2020 in Bamberger 2000 op.cit) |
|
|
| B. Piloting, evaluating and scaling-up community antiretroviral treatment (ART) support groups in Mozambique (Rutenberg and Heard 2018 3ie publication) |
|
|
| 5. Strengthening policymaking | ||
| A. Ethiopia: Using qualitative methods to strengthen economic analysis: Household decision-making on malaria prevention (Lampietti 2000) in Bamberger 2000 op.cit |
|
|
Part 2
Section 2.1 Examples of the application of mixed methods with quantitative and qualitative dominant designs
Figure 1 is an example of a quantitative dominant mixed-methods design. This was an evaluation to estimate the proportion of rural women in a West African country who used rural health centers and to assess their opinions on the services they received. The evaluation used a quantitative national household survey but there was criticism that the study might have a positive bias as some women might not wish to criticize the government health centers. Consequently, the national sample was used to select a representative sub-sample of rural areas to conduct a qualitative follow-up study that combined observation of how the clinics operated with in-depth interviews with village women, health center staff and key informants, including civil society and women’s organizations. It was important to ensure a representative sample of villages because there had been a criticism that earlier studies conducted by women’s organizations had deliberately selected villages where it was known that the health centers had received many complaints of sexual harassment and poor service for poorer women who also did not speak French. The qualitative study confirmed that many women were reluctant to use the health centers because of the way they were treated. Direct observation of the clinics proved to be an important tool because the reluctance of poor women to enter the clinic and the unwelcoming reception they received could be observed. Great care was taken to ensure that a statistically representative sample of villages was selected so as to increase the credibility of the qualitative findings.
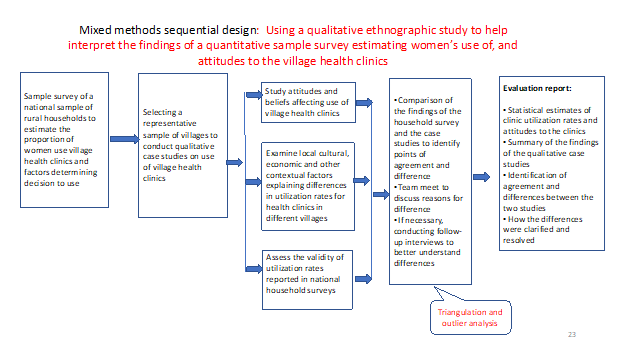
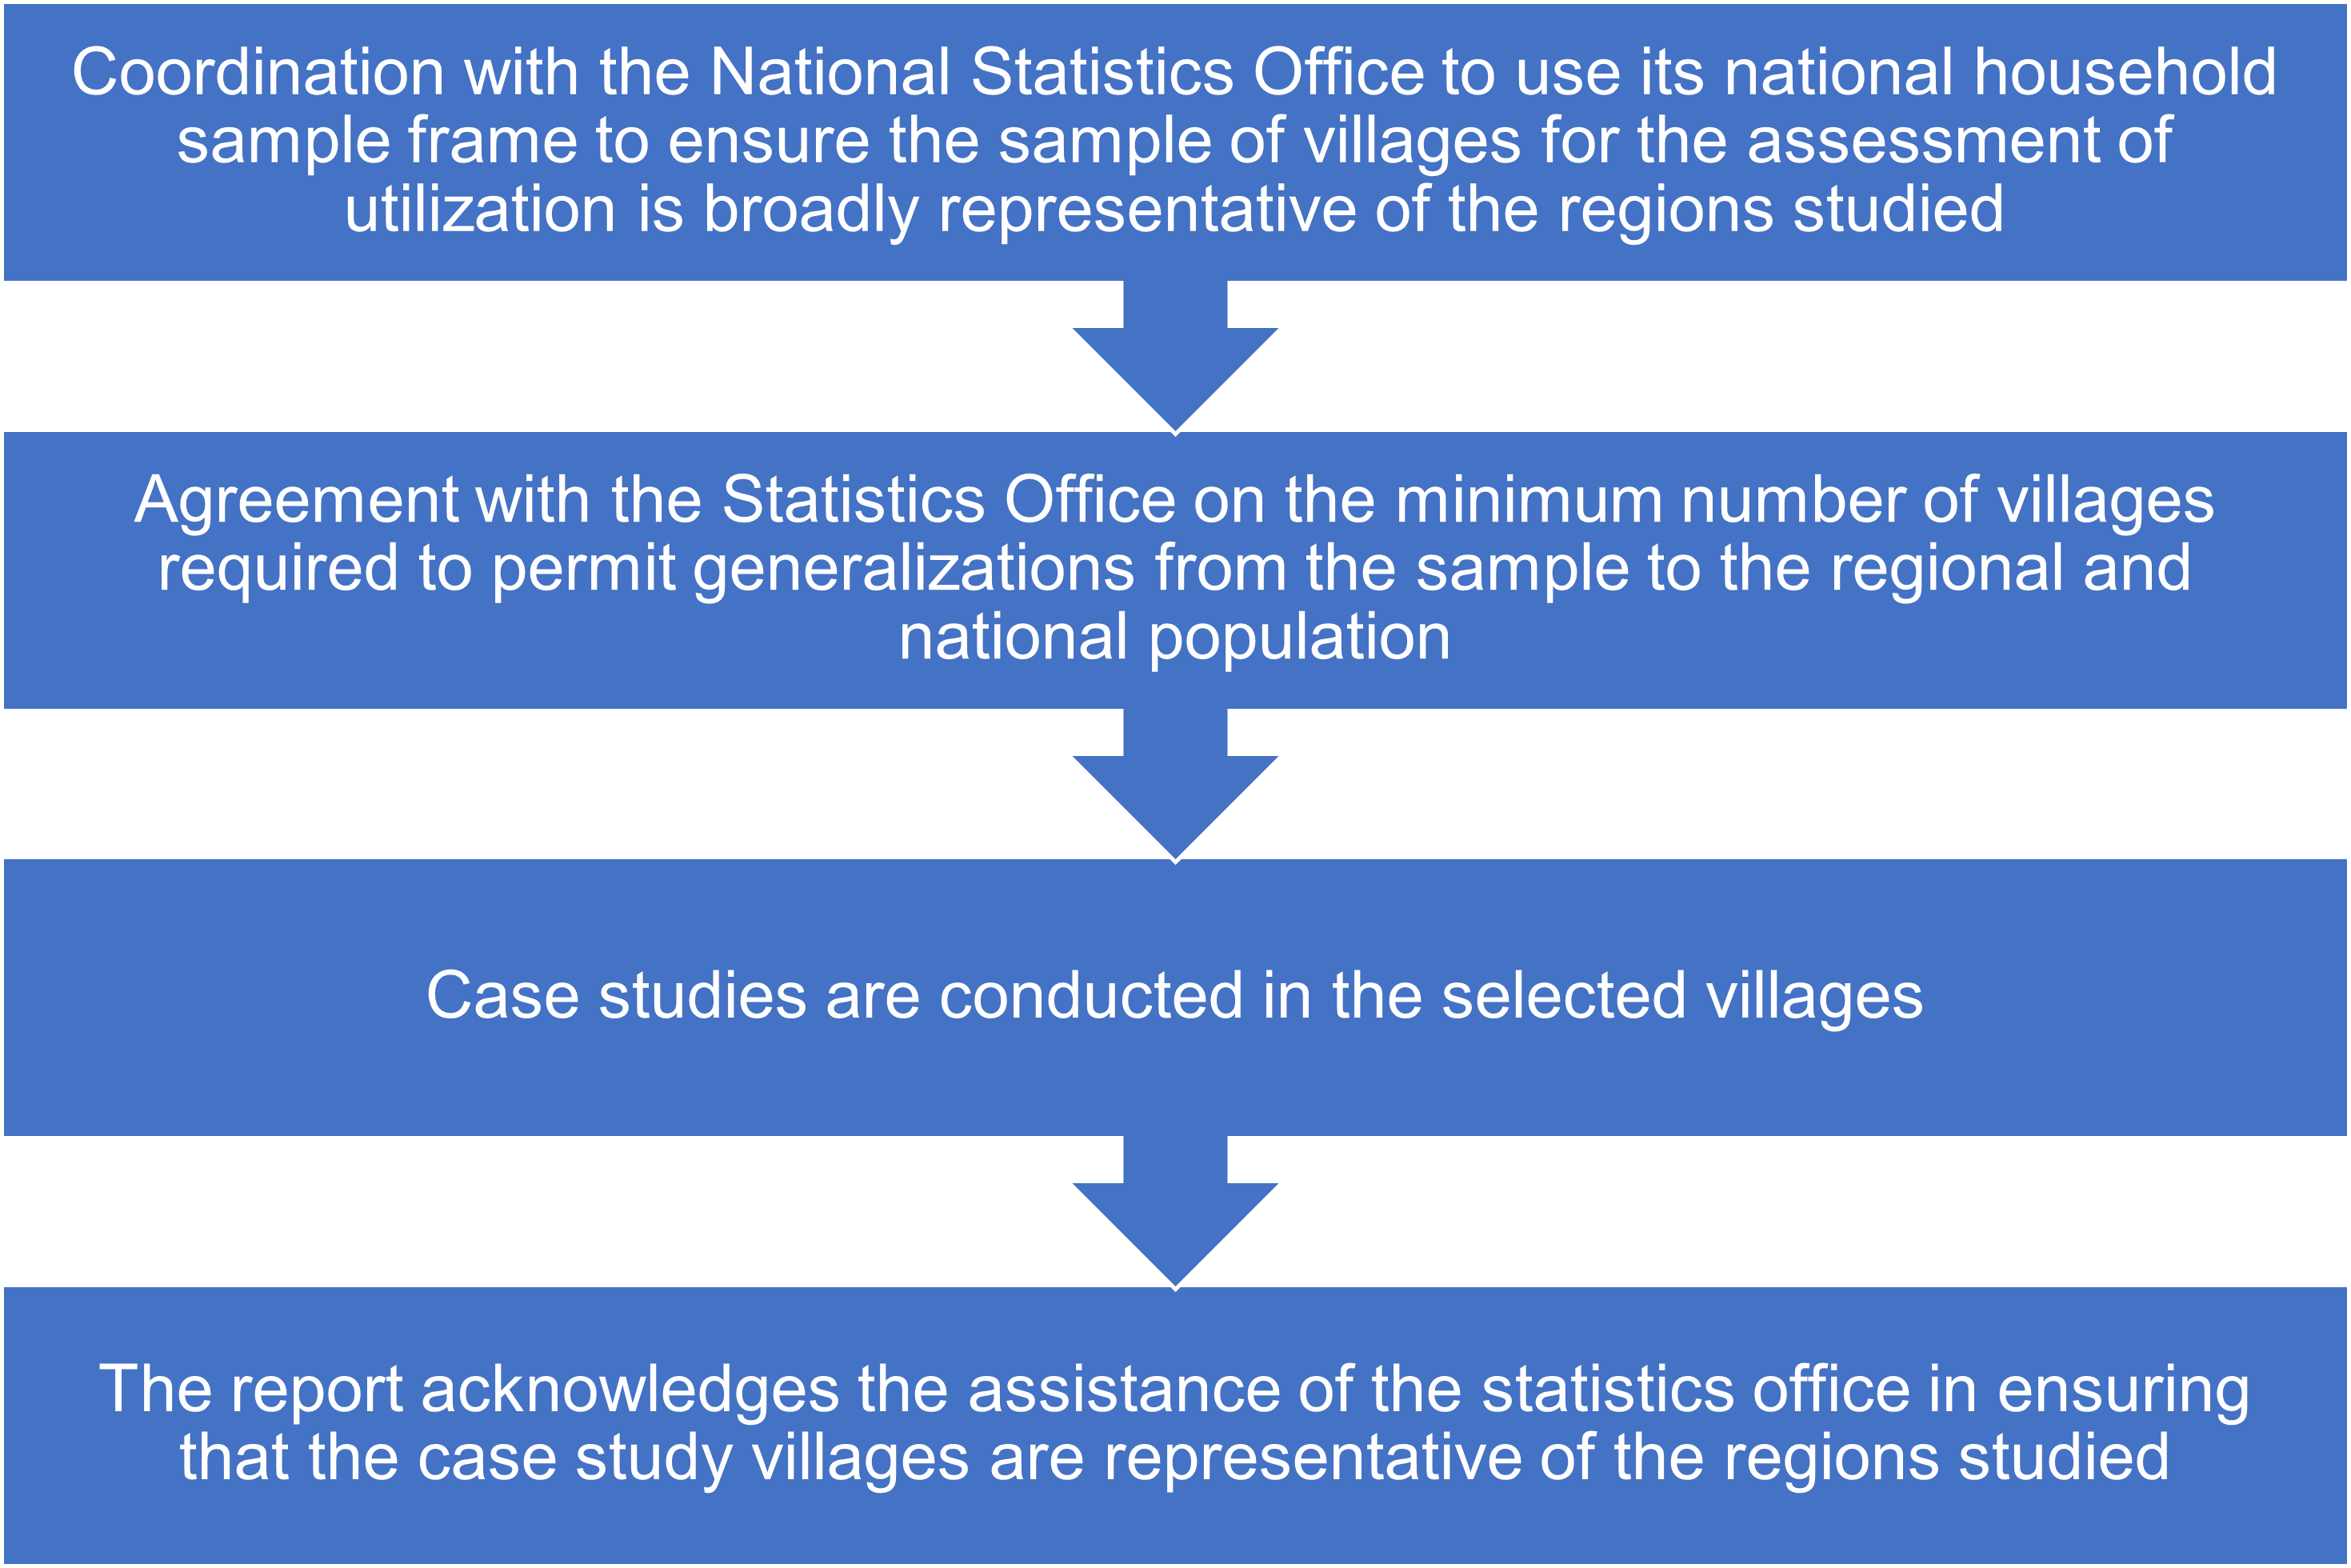
Figure 2 illustrates how a similar design could be used, but where the qualitative design is dominant. In this scenario, the qualitative evaluation team coordinates with the National Statistics Office to use the national household sample frame to ensure the sample of villages selected for the qualitative study is broadly representative of all villages in the regions studied. Collaboration with the statistics office is essential to ensure the credibility of the qualitative study and to address criticism of sample selection bias.
Figure 2 Qualitative dominant evaluation of the access of women to rural health centers
Section 2.2 Inductive and deductive hypotheses
An important distinction between the two research approaches concerns how hypotheses are constructed. Most quantitative research uses deductive hypotheses. The hypotheses are derived logically from an existing theory or previous research and are defined at the start of the evaluation. Often the project is based on a particular hypothesis that gets tested in the evaluation. Often the hypotheses will not be changed during the course of the evaluation, although it is possible they may be refined based on initial research findings. For example, in the evaluation of a program to increase school enrolment and graduation rates, the hypothesis may be that the main reason that children do not attend school is extreme poverty forces parents to keep children out of school so that they can earn money. This could be tested by comparing enrolment rates for households with different income levels. In contrast, most qualitative evaluations develop inductive hypotheses where the hypotheses are identified based on exploratory fieldwork and observation. While the inductive hypothesis is defined before fieldwork begins, the inductive hypothesis will be refined as the evaluators gain a better understanding of the project, the attitudes of participants and the socio-economic context within which the project operates.
Section 2.3 Examples of the kinds of information that are provided on the program context
Programs are designed and implemented within a specific context that is affected by a wide range of economic, political, legal and administrative, demographic, socio-cultural and climatic factors. Many of these combine in different ways in different communities or local contexts. Often, projects which are designed and implemented in the same ways will have different outcomes in different areas due to the different ways in which these contextual factors operate. This contextual information may be presented in a narrative form to provide general background information, or the impact of each factor in each locality can be assessed.
One analytical approach is to rate each variable in terms of whether it had a positive, negative or zero influence in each locality. If the sample of subjects or communities is relatively large, these ratings can be incorporated into the regression analysis to identify which factors have a statically significant influence. A small sample of communities can then be selected for more in-depth case studies. Different analytical techniques will be required for smaller samples.
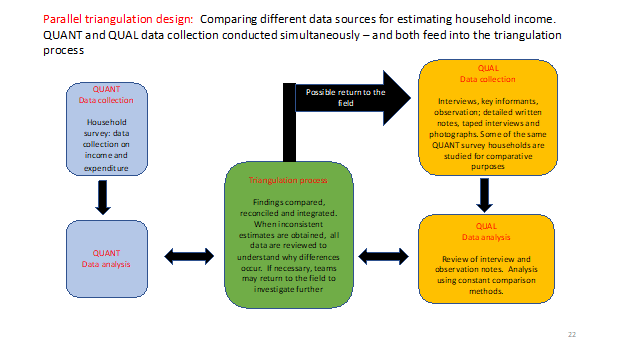
Section 2.4 Example of a parallel design
The following figure illustrates a common application of a parallel mixed-methods design which is often used during the pilot stage of an evaluation survey to test the validity of survey questions through triangulation. In this example, triangulation is used to test the validity of estimates of household income obtained through structured survey questions. At the same time the quantitative survey is being tested, a qualitative study is used to obtain estimates of income through combining unstructured interviews with households, with direct observation of the conditions of the household (quality of house construction and of furniture of cooking and electrical products, indications of home-based economic activities such as preparing food for sale, hairdressing, etc.), and possibly conversation with neighbors. The teams working on the surveys and the qualitative studies meet to compare (triangulate) their findings and to see whether the findings are consistent. It is quite common to find that the qualitative estimates of household income are higher because they detect informal sources of income that were not captured in the surveys. In cases where the estimates from the two sources are inconsistent, the researchers may return to the field to test refined instruments.
Parallel mixed-methods approaches can be a powerful way to enhance data quality, but it is difficult to have two different teams working in the field at the same time, and complicated to coordinate regular meetings and follow-up visits to the field. So, in practice, parallel mixed methods are used much less frequently than sequential studies.
Section 2.5 Main types of sample design
There are four approaches used in the selection of subjects for mixed-methods evaluations:
• Randomized designs: where subjects (households, school, etc.) are randomly assigned to the project (experimental) and control groups
• Quasi-experimental designs: in cases where it is not possible to randomize, the project and control groups can be matched on socio-economic characteristics using one of two methods:
o Statistical matching: using techniques such as propensity score matching, regression discontinuity, and pipeline designs
o Judgmental matching: when sample survey data is not available for statistical matching, the sample selection may be based on judgmental matching using expert opinion
• Purposive sampling: qualitative studies often work with small samples where random selection is not possible, and cases are selected judgmentally to fill each of the categories of interest (for example, working mothers with small children and without small children; fishermen who are members of the fishing cooperative and who work on their own
• Evolving case selection: ethnographic studies will often begin by targeting a few subjects of interest, and the number of interviews will expand as the researcher is introduced to more people. While the respondents are not statistically representative, it is possible to contact most key actors in the original respondent’s networks, and consequently, a much richer insight is obtained into the operation of social and economic groups or systems. This will often make it possible to meet with many people (sex workers, illegal squatters, people in the informal economy, ethnic minorities) who would normally not be captured in formal sample selection procedures.
Section 2.6 Nested designs
With a nested design, one or more sub-samples are selected and compared to each other and to the total sample. For example, in a study of secondary schools, sub-samples may be selected of schools that have special scholarship programs for goals, and schools that do not. The two sub-samples might be compared, for example, on the proportion of female students or on graduation rates (for an example of a nested design, see Tashakkori, Johnson and Teddlie 2021 Box 6.3 p. 175)
Section 2.7 Examples of common data collection methods
Qualitative methods commonly used in mixed-methods evaluations
- Case-based methods: including qualitative comparative analysis (QCA)
- Interviews: key informants and in-depth interviews
- Focus groups
- Observation and participant observation
- Social network analysis: this can either be conducted qualitatively when using small samples or quantitatively (for example, analysis of email and social media communications) when working with large quantities of data
- Self-reporting: diaries, time-use and calendars
- Participatory group consultations: including PRA (participatory rural appraisal)
Quantitative methods commonly used in mixed-methods evaluations
- Household surveys: primary data collected for the study and secondary survey data
- Other sample surveys: e.g., businesses, schools, health facilities
- Economic, demographic and other socio-economic data
- Big data: satellite and drone images, social media analysis, phone company call data records, mobile phone data, ATM and other financial transfer data
- Radio call-in programs
Section 2.8 The four main types of qualitative analysis
Tashakorri, Johnson and Teddlie (2021 Chapter 9) identify four main qualitative data analysis strategies:
- Categorizing strategies: narrative data can be organized into categories to permit comparisons
- Contextualizing strategies: one of the benefits of mixed methods is that it is possible to obtain important contextual data on the project areas and the broader context within which the projects operate. As we discussed earlier with respect to complexity analysis it I possible to code the data, for example through rating scales so that the data can be incorporated into quantitative analysis
- Theming and comparing strategies: broad themes can be identified that can be incorporated into the content analysis to construct a framework for the analysis of more complex issues
- Displaying strategies: the findings of the qualitative analysis can be presented visually through charts, graphs, maps, and path models. These are helpful both to explain findings to readers, but also to help researchers identify new themes and patterns
Section 2.9 Sequential analysis
Most mixed-methods evaluations use sequential designs where quantitative data either precedes or follows qualitative data collection. In a small number of studies there can be several rounds of sequential data collection. Consequently, most analysis designs are also sequential:
- Sequential qualitative-quantitative analysis: In most cases the qualitative analysis is used to inform the design of the following quantitative stage of data collection, but it also provides data that can be incorporated into the quantitative analysis after the quantitative data collection has been completed. With these designs, the qualitative analysis is often exploratory and used to provide a better understanding of the context, including the experience of the target population with earlier similar projects. The analysis can also be used to develop typologies to be used in the formulation of the quantitative design. While the qualitative data is often used to improve the design of the quantitative survey instruments or the sample design, it can also be used to strengthen the theory on which the study is based
- Sequential quantitative-qualitative analysis: The following are some of the widely-used approaches:
- Creating typologies that can be explored through case studies and other kinds of qualitative methods
- Outlier analysis: rapid return to the field to help explain cases that fall outside of the main pattern. For example, the small number of families that did not send their children to school. In the Indonesia village water supply project, in all but one village it was the women who managed the water supply. The one village where men were reported as managing the water supply, the researchers returned to the village to check if this was a reporting error or to seek an explanation. It was found that this was the only village where dairy farming was practiced. This was much more economically productive than casual labor (which was the only option in most villages), and as it was believed that only women could milk the cattle (men’s hands were too rough), so men agreed to manage the water supply to allow women to practice dairy farming. This proved to be a very important finding
- Projects can be classified as effective or ineffective on the basis of quantitative analysis and then follow-up qualitative case studies are conducted to help understand the factors determining effectiveness
- Qualitative methods can be used to confirm and refine categories initially identified in the quantitative analysis
- Iterative mixed methods: In cases where there are two or more rounds of sequential quantitative and qualitative analysis, similar approaches to those discussed above are used, but sometimes with several iterations
Section 2.10 Rating scales
Rating scales are used to transform descriptive, narrative data into a format that can provide ordinal data that can be used to prepare tables comparing scores from different communities, projects or organizations. Importantly the data can also be incorporated into impact evaluations. The following example illustrates the use of a 5-point scale to rate how well project implementation complies with the project implementation guidelines (protocol). In this case ‘5’ indicates a high level of compliance, 4 = above average compliance, 3 = average compliance, 2 = below average and 1= very poor. It is also possible to include 0= no information or not applicable. Some rating scales do not include the ‘average’ category and only use a 4-point scale.
| Rating scale for assessing compliance with project implementation guidelines | |
| Compared with other similar projects, the level of compliance with the implementation guidelines was: | Rating scores |
| 5. Very high | 5 |
| 4. Above average | 4 |
| 3. Average | 3 |
| 2. Below average | 2 |
| 1. Very poor | 1 |
Section 2.11 Outlier analysis
Often regression-based impact evaluations will identify a small number of cases that do not conform to the general pattern. For example, there may be a small group of households that do not enroll their children in school or mothers who do not take their children to the clinic for regular checkups. Often the data does not permit an explanation for the reasons for deviance and sometimes the outlier will be assumed to be a reporting error and will be ignored. In other cases the researchers can only speculate or they signal this as a question to address in a future study. One of the recommendations for a mixed-methods design is to budget time and resources for a quick return to the field to explore the reasons for the outliers. Sometimes the follow-up field visit can produce very important findings concerning the reasons for the variation.
In the evaluation of the village water supply project in Indonesia the analysis found that with the exception of one village, it was always reported that women were responsible for the maintenance of the village water supply. In just one village it was reported that men were responsible for the water supply system. Initially, it was assumed that this was a reporting error, but it was possible for one of the qualitative researchers to make a follow-up visit to several villages, including the one where the men were reported as being responsible for the water supply. These visits provided an important insight that changed the focus of the report. In this part of Indonesia, there were very few income-earning opportunities for women, so they were put in charge of the water supply while men looked for work. However, in the area where men managed the water supply, dairy farming was practiced and this was much more profitable than the kinds of casual work that most men found. It was believed that men’s hands were too rough to milk the cows properly, so this work was assigned to women, and men managed the water supply. Consequently, families were making a rational economic decision to allow the spouse with the better income-earning opportunities to work while the other spouse was in charge of the water supply. Without the follow-up field visit, this important insight would have been overlooked and men’s responsibility for water management in this village would have been dismissed as a reporting error.
Section 2.12 Different types of fully integrated mixed data analysis
Tashakkori, Johnson and Teddlie (2021 pp 283-5) use the term fully integrated mixed-method data analysis to refer to “a more complex category where there are multiple interactive types of integration of qualitative and quantitative analysis in a mixed-methods project”. This might combine sequential analysis, parallel analysis, cross-tracks analysis and other types of analysis.
Section 2.13 Cross-over analysis and inherently mixed analysis techniques
Cross-over analysis refers to “using aspects of the analytical framework of one methodological tradition within the analysis from another tradition” (Greene 2007 p.155). Examples cited in Tashakkori, Johnson and Teddlie (2021 pp 285-286) include:
Applying quantitative analysis to qualitative data:
- Converting qualitative descriptive data to a numerical format (for example rating scales or dichotomous variables) that can be incorporated into quantitative impact evaluation analysis
- Factor analysis of qualitative data
- Cluster analysis
- Hierarchical linear modeling
- Bayesian analysis
Applying qualitative analysis techniques to quantitative data:
- Conversion of quantitative data into categories and profiles
- Mixed methods discourse analysis
- Coding quantitative data into categories. An example discussed earlier applies this approach to the classification of contextual variables into categories in complexity analysis
Inherently mixed-methods analysis:
Tashakkori, Johnson and Teddlie (2021 pp 286-290) also give examples of “inherently mixed-methods analysis” techniques that are unique to mixed methods and not adapted from either quantitative or qualitative methods:
- Construction of multiway matrices for comparison of quantitative and qualitative outcomes
- Qualitative comparative analysis (QCA): using the case (individual, household, community, country) as the unit of analysis, QCA identifies necessary and sufficient conditions for an outcome to occur or not to occur. A useful tool for complexity analysis
- Social network analysis: mapping patterns of linkages and communication among the actors involved in a project or activity and tracking the evolution of the networks over time. The analysis can be done manually for small, local projects or using software to analyze data obtained from the analysis of, for example, large volumes of emails
- Mixed coding: using codes that represent both quantitative and qualitative dimensions such as causation, magnitude and process coding
- Social media analysis
- Geographic information systems and geospatial data (satellite and drone images). Using qualitative data for ground-truthing of the interpretation of images, and for providing context to help interpret the findings
- Ethnographic decision models for quantitative data